Select a topic...
TUTORIAL: USING BUILTIN RECIPES
A tutorial for running a correlational analysis with two detectors in real-time.
TUTORIAL: MAKING RECIPES
Learn more about how to create an ETA recipe for your experiment.
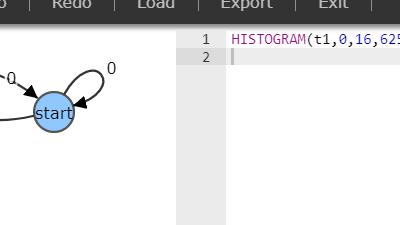
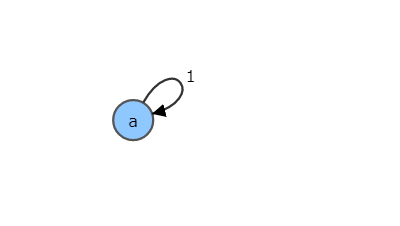
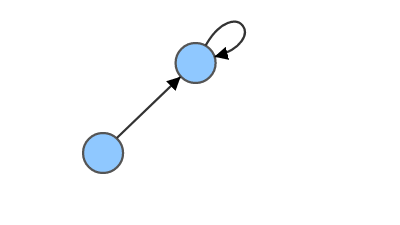
CHEATSHEET: DRAWING TRANSITION GRAPH
How to draw the transition graphs in Instrument Designer.